When is the next great tide near you?
Share opens your device's share sheet; Copy link is always there beside it — Great Tides itself sends nothing.
Great Tides ranks the next 90 days of NOAA tide predictions for each place below and shows you the dates worth planning around — the lowest daylight tides for tidepooling, the highest king tides, and the biggest tidal swings. Rankings cover November 2, 2026 to January 30, 2027.
Coverage: California only — fourteen places, from Crescent City to La Jolla
Type a town, beach, or landmark. Or use your location, or show a place you saved in this browser.
No place matches “”. Great Tides covers fourteen California coastal places, from Crescent City in the north to La Jolla in the south, and no others yet. Search matches place names and nearby beaches, towns and landmarks — try Pillar Point, Eureka, Capitola, Malibu or Scripps.
— optionally, let your browser show the places nearest you. Your location is used only in your browser to work out distances; it is never sent anywhere or saved.
— no saved places yet; use the Save place button on a card below.
My places
Your saved places and the next daylight low at each. Saved only in this browser, on this device; the list does not follow you to another browser.
Soonest great tide in California
A statewide pick, not a local one. It may be far from you. Find your place above for tides near you.
Low tide
1.28 ft (0.39 m) Low 1.5 ft or lower
See La Jolla tidesKing Tides November 24–26, 2026 — the highest highs and lowest lows of the season. See the King Tides page.
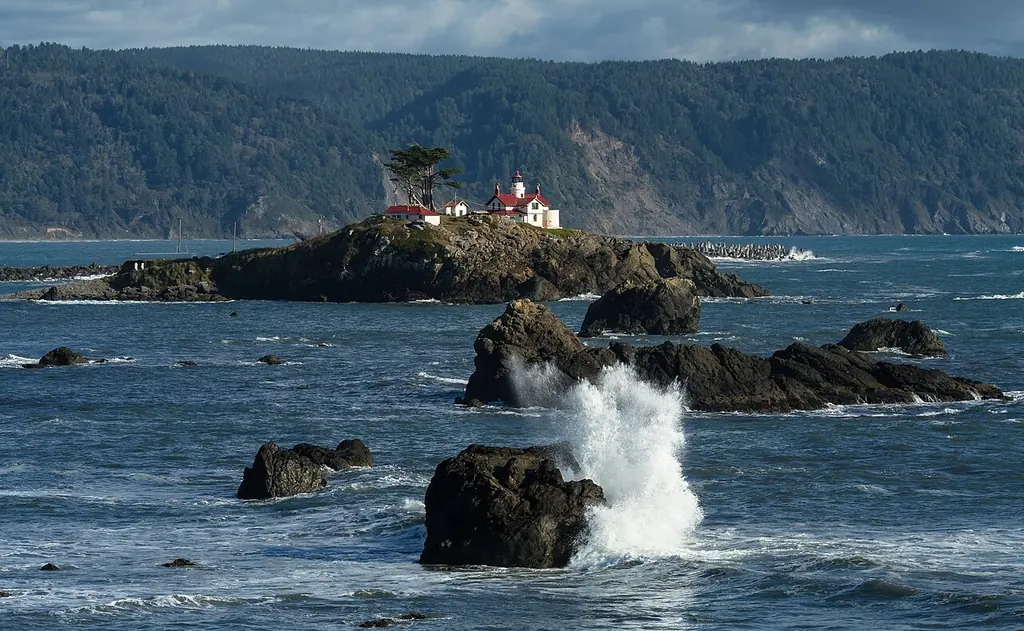
Crescent City
Next exceptionally high: Sunday, November 22 · 8:54 AM · 7.71 ft (2.35 m)
NOAA station CRESCENT CITY (9419750) · heights in feet (meters), datum MLLW
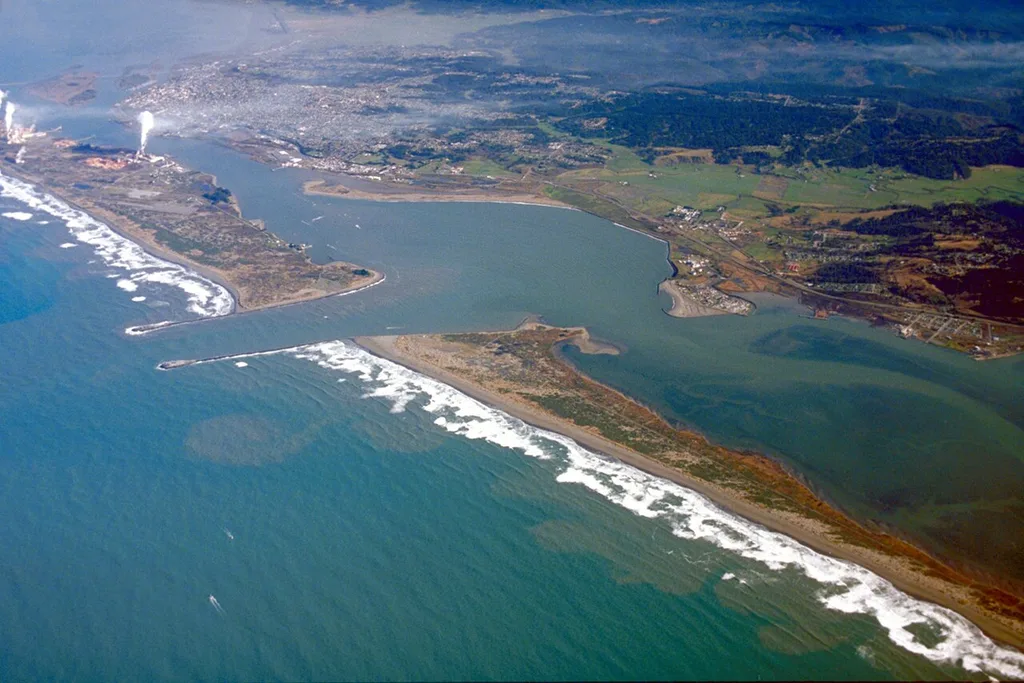
Humboldt Bay
Next exceptionally high: Monday, November 23 · 9:44 AM · 8.13 ft (2.48 m)
NOAA station North Spit (9418767) · heights in feet (meters), datum MLLW
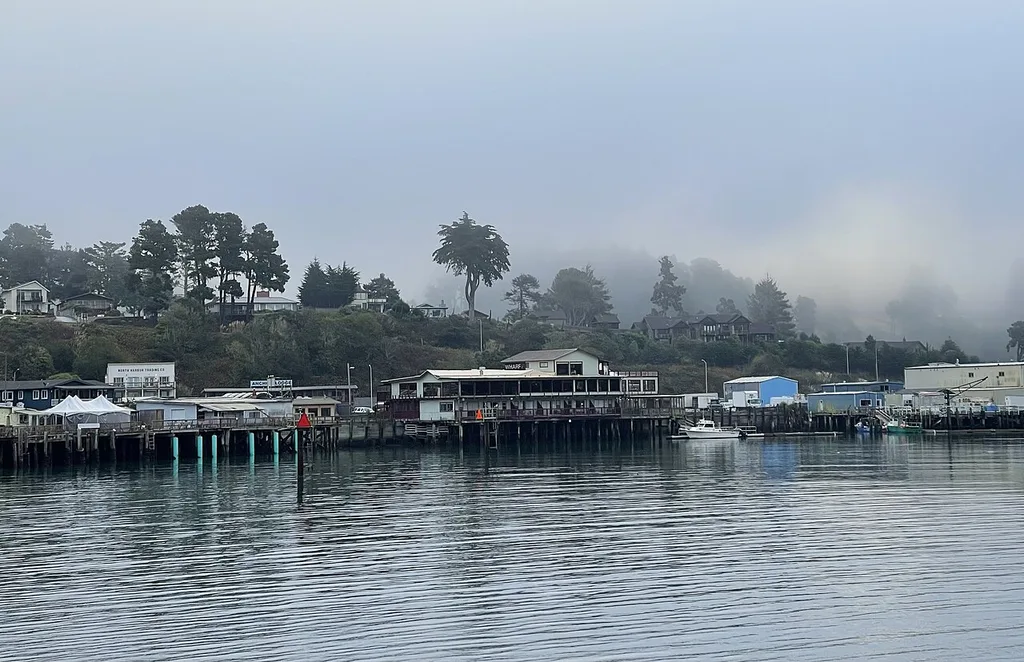
Fort Bragg & Noyo Harbor
Next exceptionally high: Monday, November 23 · 8:57 AM · 7.19 ft (2.19 m)
NOAA station NOYO HARBOR (9417426) · heights in feet (meters), datum MLLW
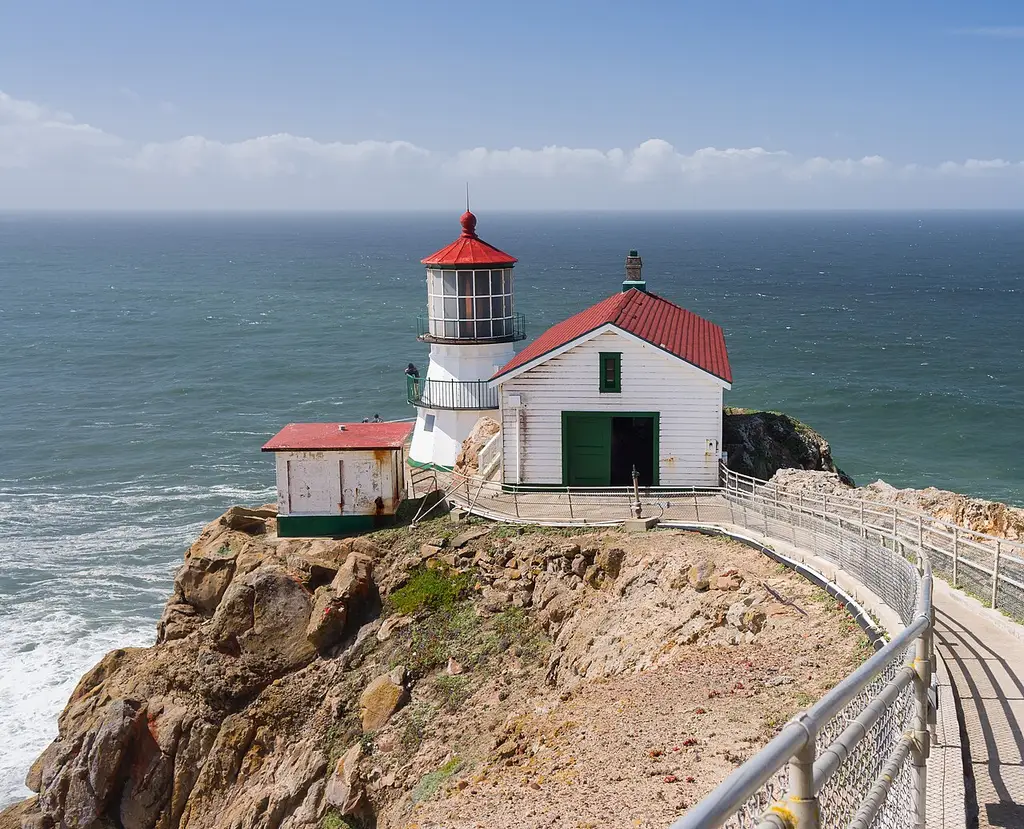
Point Reyes
Next exceptionally high: Sunday, November 22 · 8:02 AM · 6.48 ft (1.98 m)
NOAA station Point Reyes (9415020) · heights in feet (meters), datum MLLW
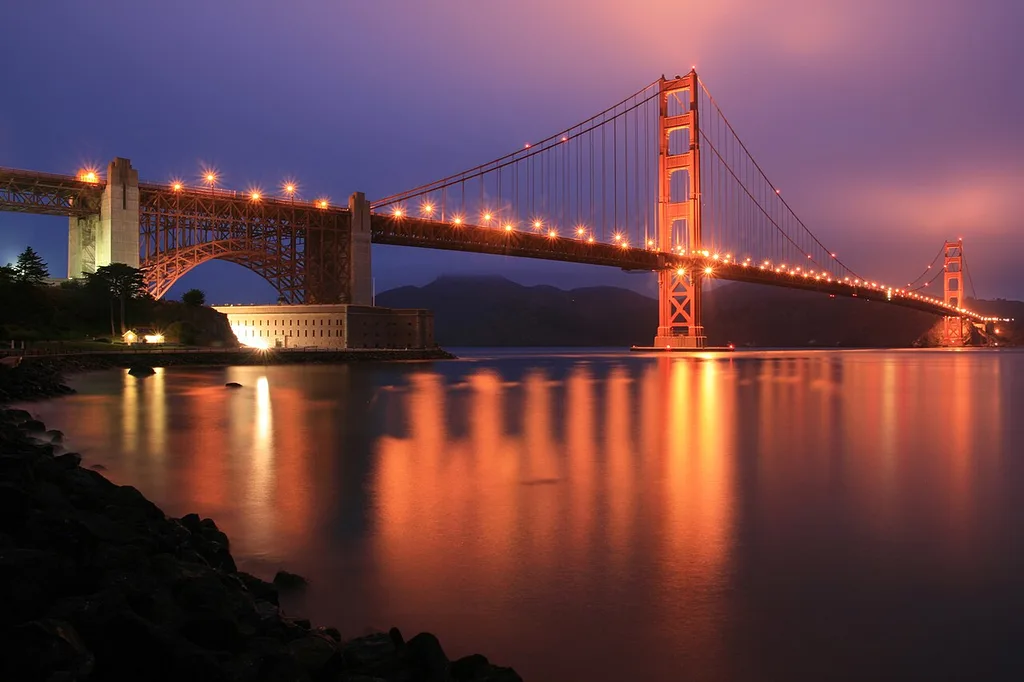
San Francisco
Next exceptionally high: Sunday, November 22 · 8:48 AM · 6.40 ft (1.95 m)
NOAA station San Francisco (9414290) · heights in feet (meters), datum MLLW
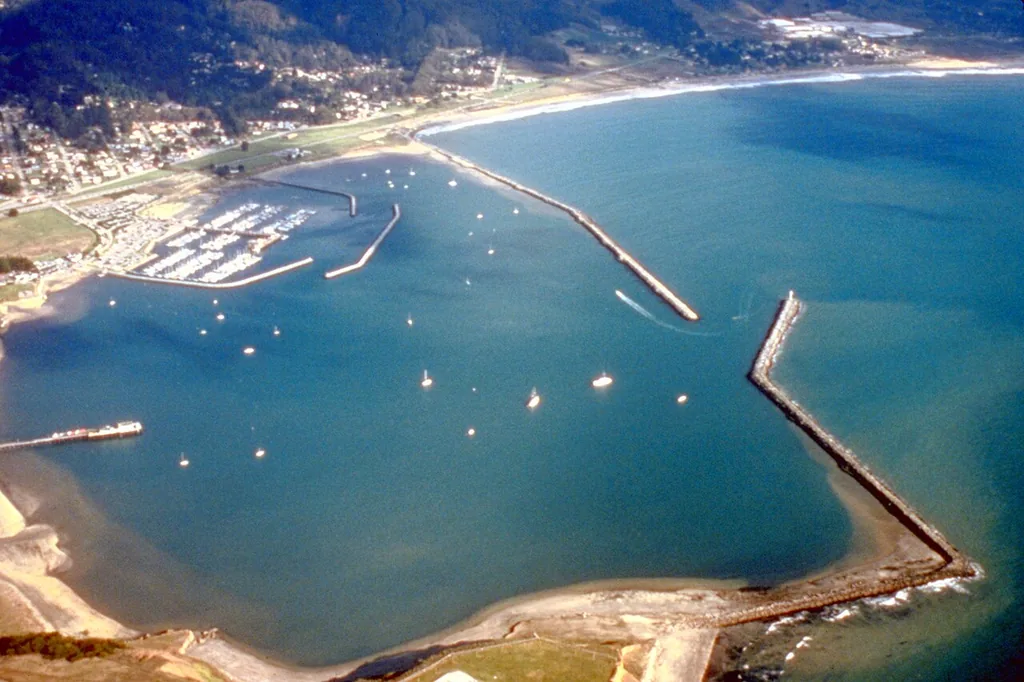
Half Moon Bay
Next exceptionally high: Sunday, November 22 · 7:53 AM · 6.25 ft (1.91 m)
NOAA station Pillar Point Harbor (9414131) · heights in feet (meters), datum MLLW
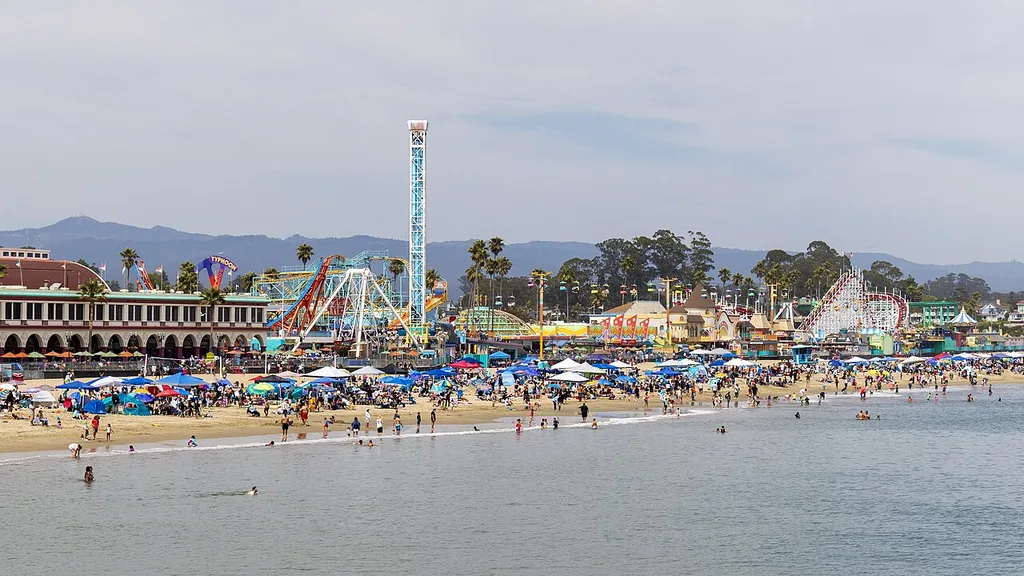
Santa Cruz
Next exceptionally high: Sunday, November 22 · 7:36 AM · 5.94 ft (1.81 m)
NOAA station Santa Cruz, Monterey Bay (9413745) · heights in feet (meters), datum MLLW
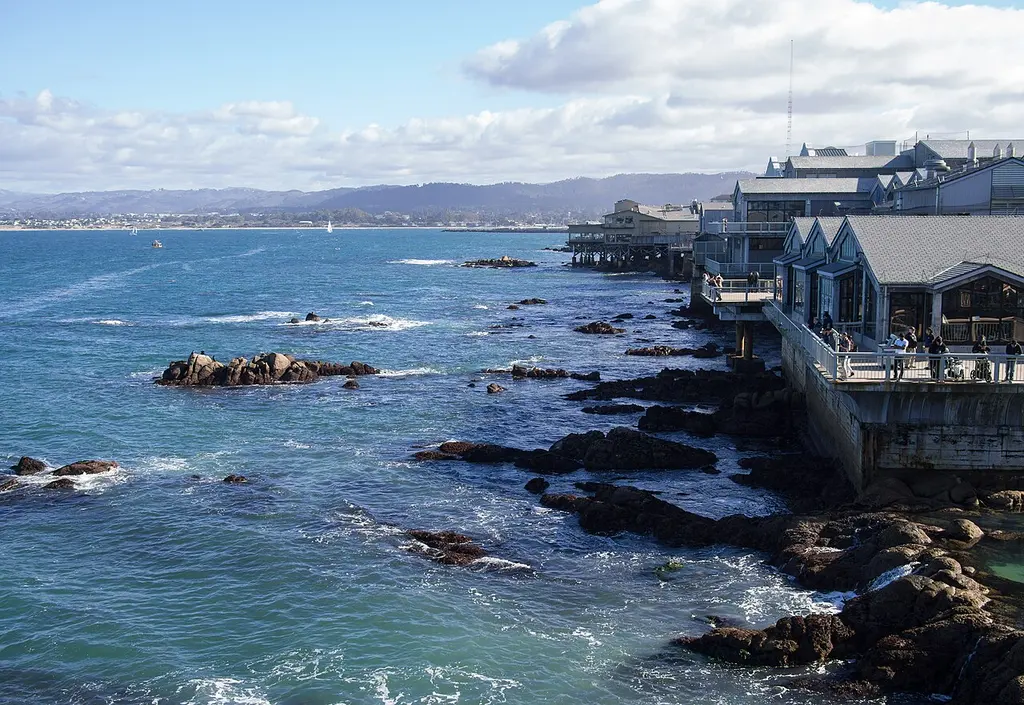
Monterey
Next exceptionally high: Sunday, November 22 · 7:42 AM · 6.12 ft (1.87 m)
NOAA station Monterey (9413450) · heights in feet (meters), datum MLLW
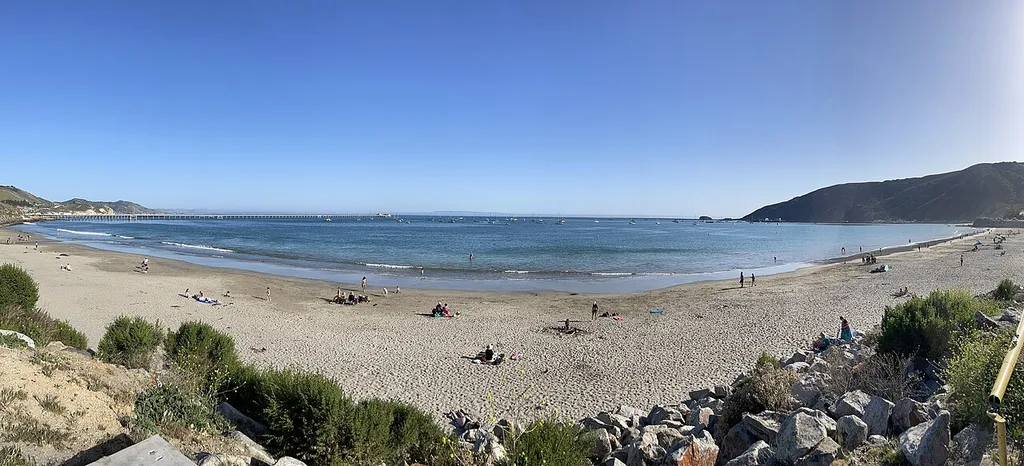
Port San Luis & Avila Beach
Next exceptionally high: Sunday, November 8 · 8:28 AM · 6.07 ft (1.85 m)
NOAA station PORT SAN LUIS (9412110) · heights in feet (meters), datum MLLW
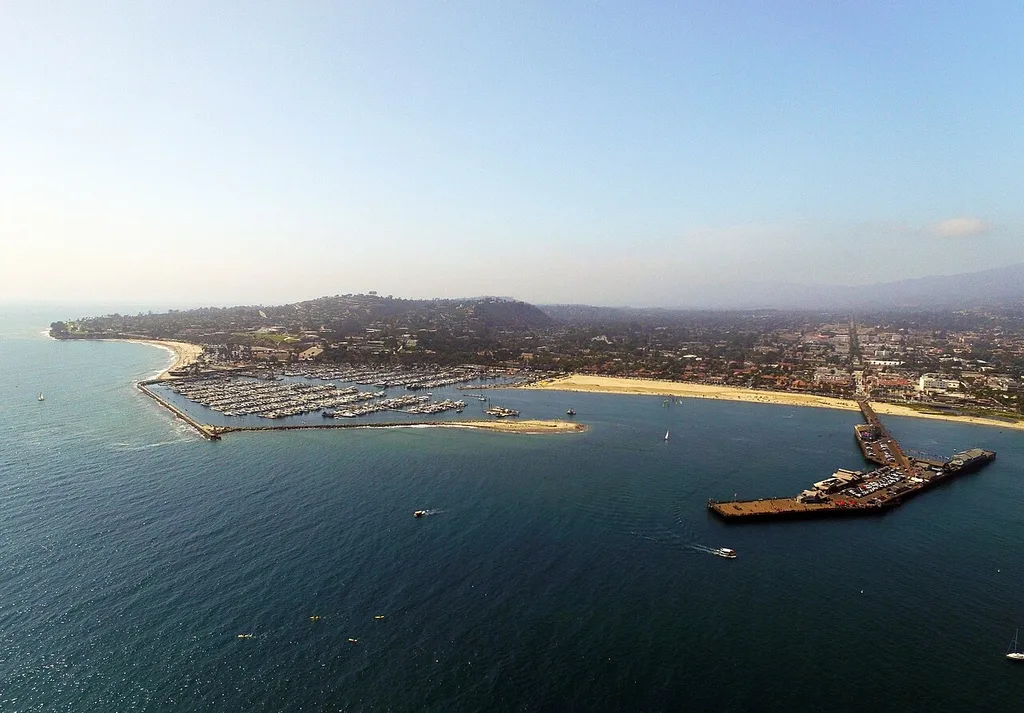
Santa Barbara
Next exceptionally high: Sunday, November 8 · 8:07 AM · 6.14 ft (1.87 m)
NOAA station Santa Barbara (9411340) · heights in feet (meters), datum MLLW
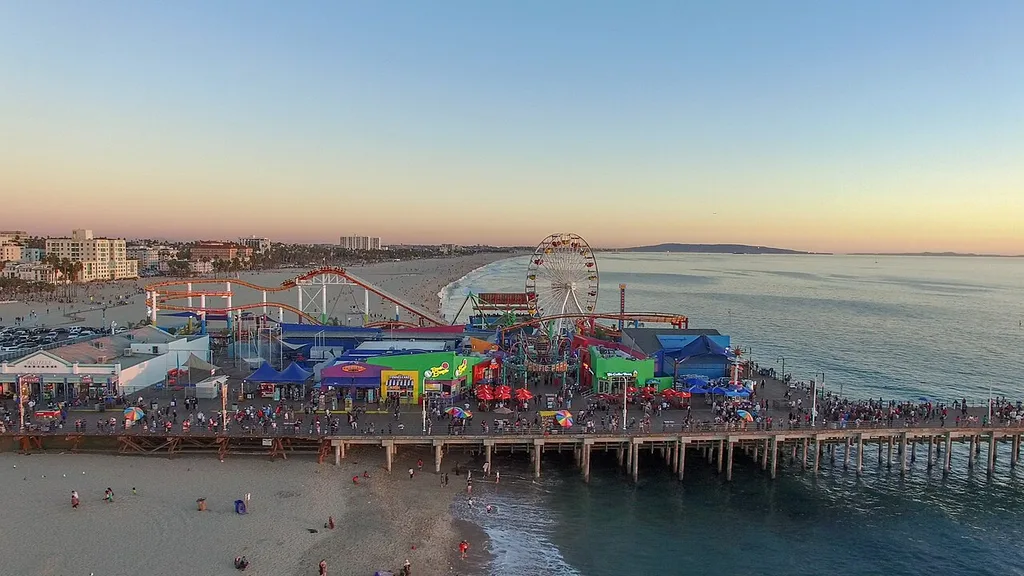
Santa Monica
Next exceptionally high: Sunday, November 22 · 6:44 AM · 6.28 ft (1.91 m)
NOAA station Santa Monica, Municipal Pier (9410840) · heights in feet (meters), datum MLLW
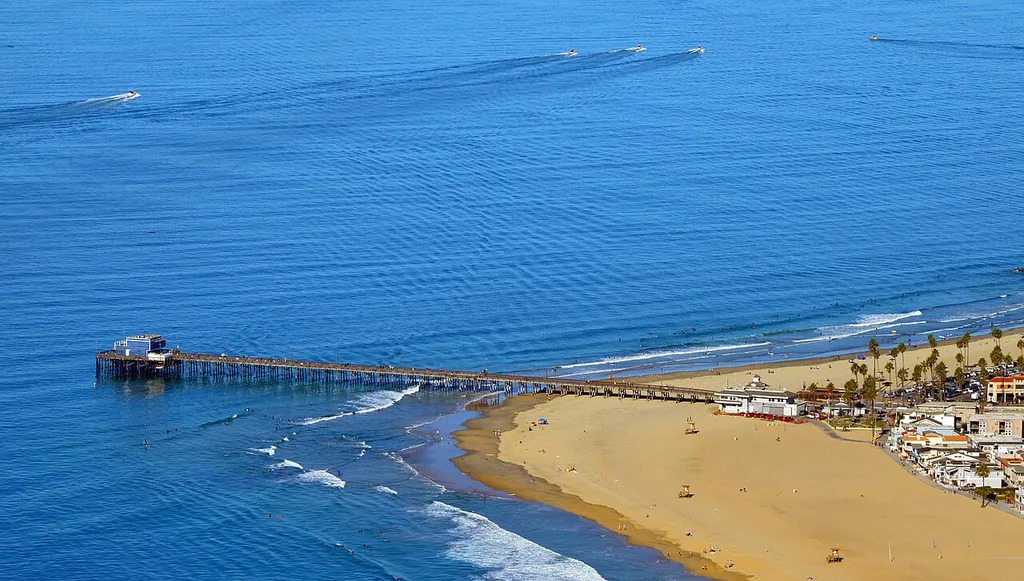
Newport Beach & Corona del Mar
Next exceptionally high: Sunday, November 22 · 6:37 AM · 6.24 ft (1.90 m)
NOAA station NEWPORT BEACH, NEWPORT BAY ENTRANCE (9410580) · heights in feet (meters), datum MLLW
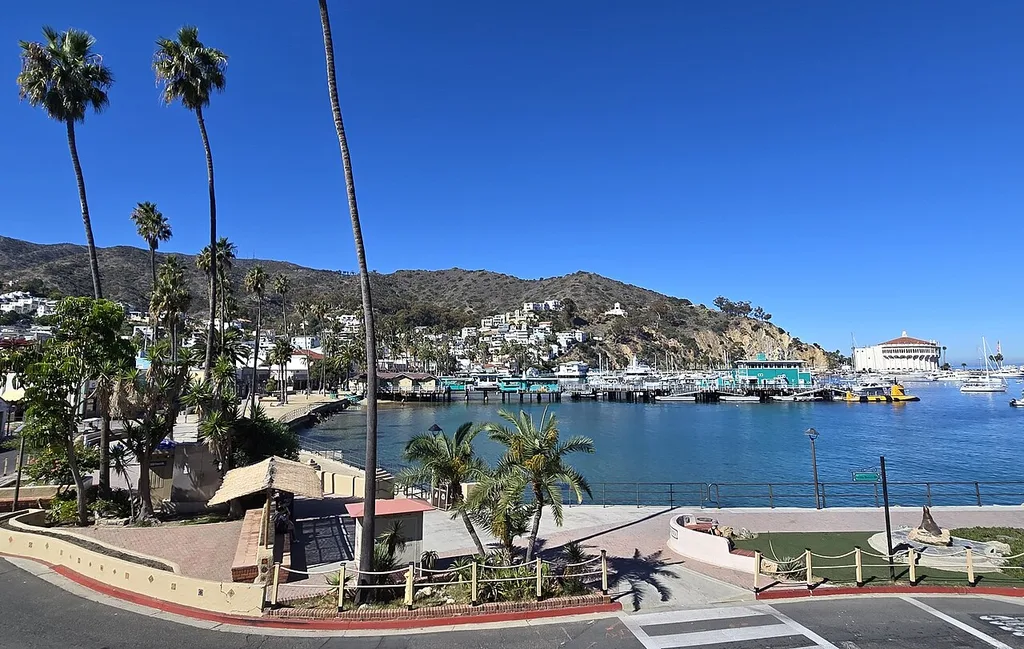
Avalon, Santa Catalina Island
Next exceptionally high: Sunday, November 8 · 7:49 AM · 6.24 ft (1.90 m)
NOAA station AVALON, SANTA CATALINA ISLAND (9410079) · heights in feet (meters), datum MLLW
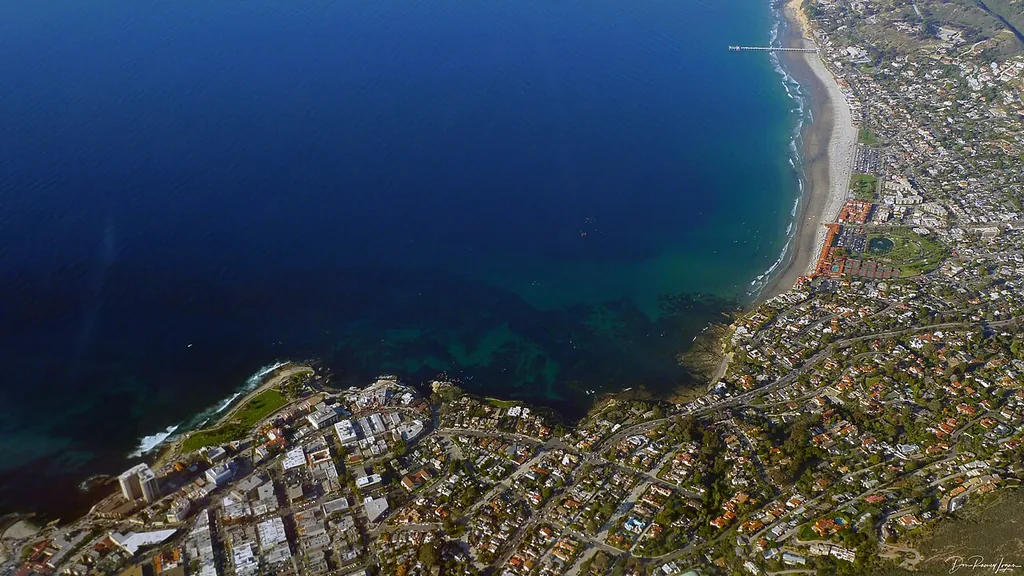
La Jolla
Next exceptionally high: Sunday, November 22 · 6:35 AM · 6.13 ft (1.87 m)
NOAA station La Jolla (Scripps Institution Wharf) (9410230) · heights in feet (meters), datum MLLW
Not sure where to go?
Start with the statewide guides: the best tides ranked across all fourteen places.
Browse the guidesStatewide guides
- Daylight low tidesBest for tidepooling→
- Weekend low tidesSaturdays, Sundays, holidays→
- Minus tidesBelow 0 ft, most reef exposed→
- Largest rangesBiggest swing in a day→
- Highest highsWaves, flooding, photos→
- Lowest lowsAny time of day→
- Next 14 daysEvery place, day by day→
- Next great tidesSoonest great tide at each place→
- By monthPlan ahead: November 2026 · December 2026 · January 2027
How to read these pages
Each place page lists its ten lowest low tides, its ten best daylight low tides, its ten best weekend daylight low tides, its ten highest high tides, and its ten largest tidal ranges in the window. It also lists every predicted high and low tide of the next 14 days in chronological order. Every list is calculated from the predictions of one nearby NOAA station, and every ranking is relative to that station. A daylight low tide of 1.5 ft (0.46 m) or lower carries a Low 1.5 ft or lower badge; at or below 0.0 ft it carries a Low 0.0 ft or lower badge. The badges state height only: a lower low exposes more shore, but height alone does not rate a place for tidepooling. Three place pages carry a sourced local benchmark. Use Save place on a card to keep a place handy in this browser, then filter to saved places only; saved places are stored only on your device and are never sent anywhere. The place search above also matches nearby beaches and landmarks — try Pillar Point, Avila Beach, or Scripps. When a search matches a nearby name, the card says which place it belongs to; a search with no match says so instead of hiding every card. Or choose Use my location to sort the places nearest first and see how far each one is from you; that works entirely in your browser too. This page, each place page, and the guide pages have a Share button: it opens your device's share sheet, or copies the page link, so you can send the ranked tides to someone else.
Never miss a great tide
Each place has two subscribable calendar feeds, refreshed as the 90-day window rolls. Highlights is the quiet one: only the place's ten lowest low tides and ten highest high tides. The full calendar carries every daylight low tide at or below 1.5 ft, every minus tide, and every exceptionally high tide. No account and no email.
Download or subscribe? Downloading gives you a one-off copy of a feed's events as they stand today; it never updates. Subscribing gives your calendar app the same feed address to re-check, so the events stay current as the 90-day window rolls. Neither way needs an account or an email.
- Crescent City: Subscribe to highlights (20 events — only the ten lowest lows and ten highest highs) — feed address:
https://greattides.com/california/crescent-city/highlights.ics
Subscribe to the full calendar (80 events — every daylight low, minus tide and exceptionally high tide) — feed address:https://greattides.com/california/crescent-city/great-tides.ics - Humboldt Bay: Subscribe to highlights (20 events — only the ten lowest lows and ten highest highs) — feed address:
https://greattides.com/california/humboldt-bay/highlights.ics
Subscribe to the full calendar (80 events — every daylight low, minus tide and exceptionally high tide) — feed address:https://greattides.com/california/humboldt-bay/great-tides.ics - Fort Bragg & Noyo Harbor: Subscribe to highlights (20 events — only the ten lowest lows and ten highest highs) — feed address:
https://greattides.com/california/fort-bragg/highlights.ics
Subscribe to the full calendar (77 events — every daylight low, minus tide and exceptionally high tide) — feed address:https://greattides.com/california/fort-bragg/great-tides.ics - Point Reyes: Subscribe to highlights (20 events — only the ten lowest lows and ten highest highs) — feed address:
https://greattides.com/california/point-reyes/highlights.ics
Subscribe to the full calendar (83 events — every daylight low, minus tide and exceptionally high tide) — feed address:https://greattides.com/california/point-reyes/great-tides.ics - San Francisco: Subscribe to highlights (20 events — only the ten lowest lows and ten highest highs) — feed address:
https://greattides.com/california/san-francisco/highlights.ics
Subscribe to the full calendar (88 events — every daylight low, minus tide and exceptionally high tide) — feed address:https://greattides.com/california/san-francisco/great-tides.ics - Half Moon Bay: Subscribe to highlights (20 events — only the ten lowest lows and ten highest highs) — feed address:
https://greattides.com/california/half-moon-bay/highlights.ics
Subscribe to the full calendar (84 events — every daylight low, minus tide and exceptionally high tide) — feed address:https://greattides.com/california/half-moon-bay/great-tides.ics - Santa Cruz: Subscribe to highlights (20 events — only the ten lowest lows and ten highest highs) — feed address:
https://greattides.com/california/santa-cruz/highlights.ics
Subscribe to the full calendar (85 events — every daylight low, minus tide and exceptionally high tide) — feed address:https://greattides.com/california/santa-cruz/great-tides.ics - Monterey: Subscribe to highlights (20 events — only the ten lowest lows and ten highest highs) — feed address:
https://greattides.com/california/monterey/highlights.ics
Subscribe to the full calendar (85 events — every daylight low, minus tide and exceptionally high tide) — feed address:https://greattides.com/california/monterey/great-tides.ics - Port San Luis & Avila Beach: Subscribe to highlights (20 events — only the ten lowest lows and ten highest highs) — feed address:
https://greattides.com/california/port-san-luis/highlights.ics
Subscribe to the full calendar (83 events — every daylight low, minus tide and exceptionally high tide) — feed address:https://greattides.com/california/port-san-luis/great-tides.ics - Santa Barbara: Subscribe to highlights (20 events — only the ten lowest lows and ten highest highs) — feed address:
https://greattides.com/california/santa-barbara/highlights.ics
Subscribe to the full calendar (83 events — every daylight low, minus tide and exceptionally high tide) — feed address:https://greattides.com/california/santa-barbara/great-tides.ics - Santa Monica: Subscribe to highlights (20 events — only the ten lowest lows and ten highest highs) — feed address:
https://greattides.com/california/santa-monica/highlights.ics
Subscribe to the full calendar (83 events — every daylight low, minus tide and exceptionally high tide) — feed address:https://greattides.com/california/santa-monica/great-tides.ics - Newport Beach & Corona del Mar: Subscribe to highlights (20 events — only the ten lowest lows and ten highest highs) — feed address:
https://greattides.com/california/newport-beach/highlights.ics
Subscribe to the full calendar (83 events — every daylight low, minus tide and exceptionally high tide) — feed address:https://greattides.com/california/newport-beach/great-tides.ics - Avalon, Santa Catalina Island: Subscribe to highlights (20 events — only the ten lowest lows and ten highest highs) — feed address:
https://greattides.com/california/avalon/highlights.ics
Subscribe to the full calendar (83 events — every daylight low, minus tide and exceptionally high tide) — feed address:https://greattides.com/california/avalon/great-tides.ics - La Jolla: Subscribe to highlights (20 events — only the ten lowest lows and ten highest highs) — feed address:
https://greattides.com/california/la-jolla/highlights.ics
Subscribe to the full calendar (83 events — every daylight low, minus tide and exceptionally high tide) — feed address:https://greattides.com/california/la-jolla/great-tides.ics
For Google Calendar: on a computer, open Google Calendar Settings → Add calendar → From URL, paste the feed address of the place you want — the Copy feed address button beside each address above copies it — and choose Add calendar. Google Calendar cannot add a subscription from its mobile app.
All places in one Highlights feed: Download the highlights at all fourteen places (.ics) — 280 events, the same Highlights events as the per-place feeds above, in one file.
Or subscribe to this calendar instead of downloading it — calendar apps that support webcal subscriptions re-check this file, so the events stay current as the 90-day window rolls.
For Google Calendar: on a computer, open Google Calendar Settings → Add calendar → From URL, paste this feed address and choose Add calendar: https://greattides.com/california/highlights.ics . Google Calendar cannot add a subscription from its mobile app.
All places in one full calendar: Download the full calendar at all fourteen places (.ics) — 1160 events, the same full-calendar events as the per-place feeds above, in one file.
Or subscribe to this calendar instead of downloading it — calendar apps that support webcal subscriptions re-check this file, so the events stay current as the 90-day window rolls.
For Google Calendar: on a computer, open Google Calendar Settings → Add calendar → From URL, paste this feed address and choose Add calendar: https://greattides.com/california/great-tides.ics . Google Calendar cannot add a subscription from its mobile app.
Statewide feeds, by what you want: the same three kinds of outing, for all fourteen places in one feed each.
- Usable tidepooling, all places: Subscribe (140 events — each place's ten best daylight low tides) — feed address:
https://greattides.com/california/daylight-low-tides/daylight-lows.ics - Weekends, all places: Subscribe (140 events — each place's ten best weekend daylight low tides) — feed address:
https://greattides.com/california/weekend-low-tides/weekend-lows.ics - Exceptional highs, all places: Subscribe (140 events — each place's ten highest high tides) — feed address:
https://greattides.com/california/highest-high-tides/highest-highs.ics
Questions
When are the next California King Tides?
The California Coastal Commission's King Tides Project dates for 2026-27 are November 24-26, 2026, December 23-25, 2026, and January 21-22, 2027, statewide. The King Tides page on this site lists the highest high tide and the best daylight low tide for every place in each window.
What is a great tide for tidepooling?
Start with a daylight low tide: a low tide that falls between sunrise and sunset, when the shore it uncovers can actually be explored. The badges on this site state height only: Low 1.5 ft or lower, and Low 0.0 ft or lower. Height alone does not rate a place for tidepooling; three place pages (La Jolla, Half Moon Bay and Point Reyes) carry a sourced local benchmark, and the other places state that suitability has not been locally assessed. Each place page ranks its ten best daylight low tides in the next 90 days.
Where do these tide predictions come from?
From NOAA CO-OPS, the US agency that operates the national tide-gauge network. Great Tides downloads the high and low tide predictions NOAA publishes for one station near each place and ranks them directly; the station chosen for each place is named on its page.
Are these live water levels?
No. These are astronomical predictions, calculated in advance from the positions of the Moon and Sun. Wind, storms and air pressure push real water levels above or below the prediction, sometimes by a foot or more, and these predictions must not be used for navigation.
What were you hoping to do here today?
Have more to say? Use the feedback page instead.